Report Overview
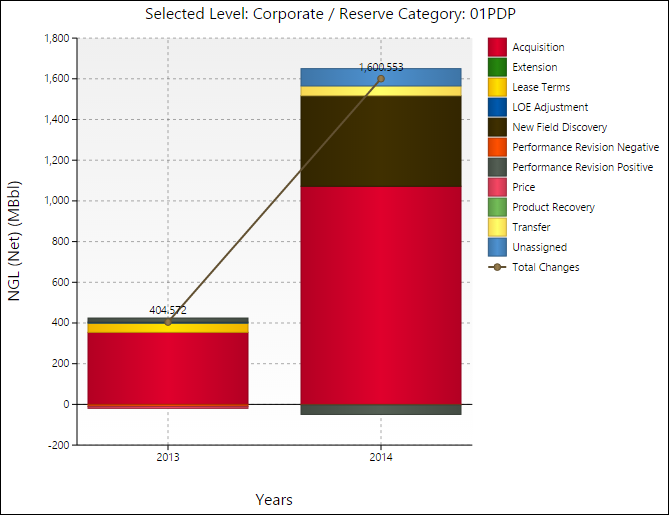
Use the Change Records by Year Chart Report to create a chart that will help you visualize change record volumes between versions. A total changes line will link all of the columns in the chart, indicating net changes from year to year.
Bar charts created with Reserves's reporting engine are interactive. For more information, see Working with Charts.
Example Report

Click image to expand or minimize.
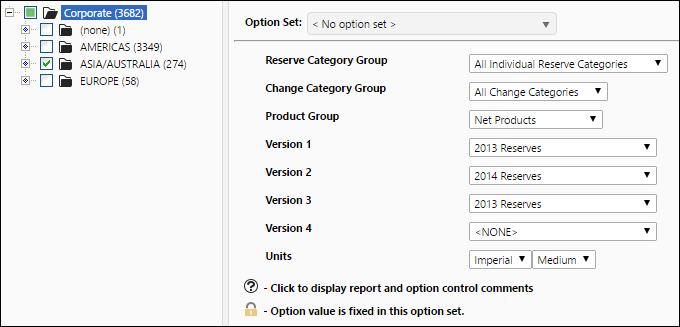
Report Options

